Meteorological environment monitoring equipment supplier
Insist on doing high-precision customer favorite technology products

Meteorological environment monitoring equipment supplier
Insist on doing high-precision customer favorite technology products

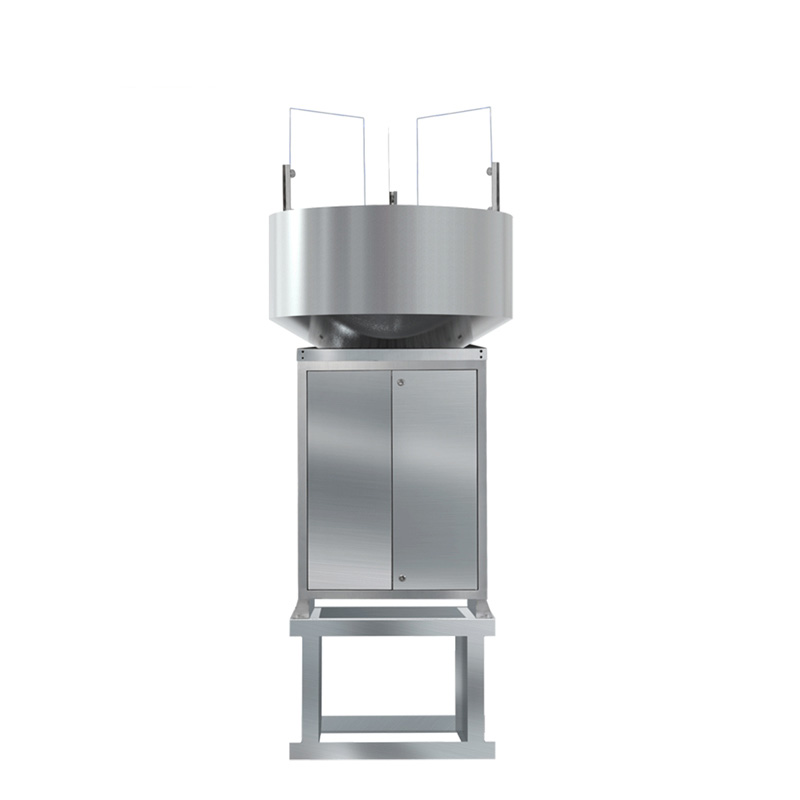
Automatic air monitoring stations, also known as "four air and two dust monitoring stations", are established to comprehensively grasp and track the ambient air quality situation and its trends in the region. The main function of these stations is to collect, monitor and analyse pollutants in the atmosphere on a regular, continuous and systematic basis, and to transmit the data obtained to the relevant platforms in real time.
The types of pollutants monitored by the air stations include, but are not limited to, sulphur dioxide (SO2), nitrogen dioxide (NO2), particulate matters (including PM10 and PM2.5), carbon monoxide (CO) and ozone (O3). These six indicators are the key parameters for measuring air quality. By monitoring these indicators, the air quality level can be effectively assessed and timely control and improvement measures can be taken to protect public health and environmental safety.
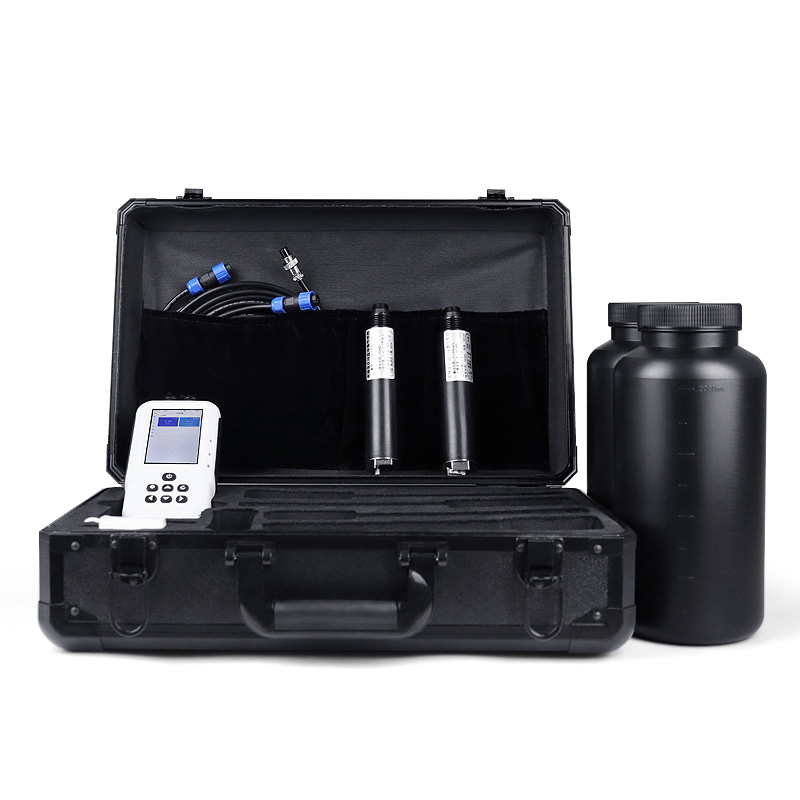
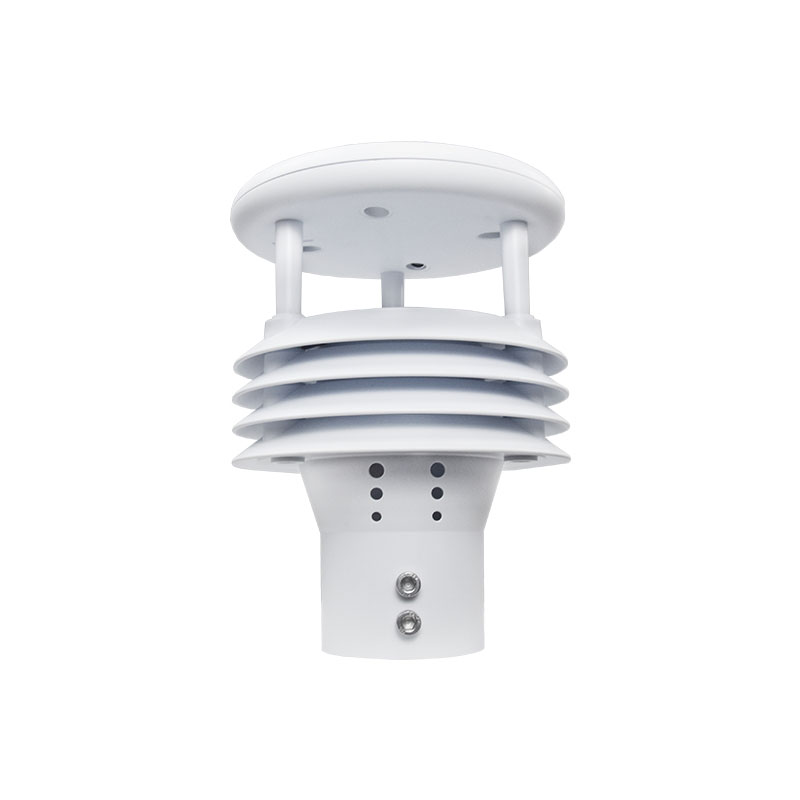
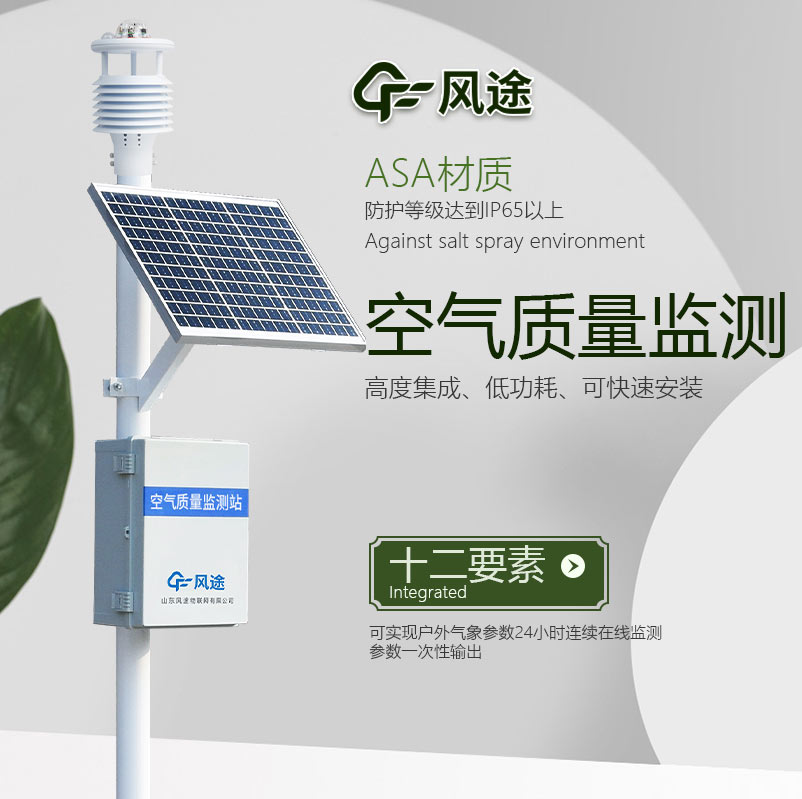
The monitoring system consists of two major parts: the monitoring terminal and the data platform. The monitoring terminals are capable of monitoring the concentration of "four gases and two dusts" (i.e., sulphur dioxide, nitrogen dioxide, carbon monoxide, ozone, as well as PM10 and PM2.5 particulate matter), and measuring the temperature and humidity of the environment, wind speed and wind direction, and other parameters. These terminals send the collected data to the data platform in real time via wired or wireless networks for real-time monitoring and analysis by management personnel.
The data platform is constructed based on Internet technology and has the characteristics of networking. It not only receives data from monitoring terminals, but also presents these data in various intuitive forms, such as reports, bar charts, pie charts, line graphs, etc., which realises the visualisation of pollution data. Such a presentation greatly facilitates managers to analyse the trend of pollutant concentration and accurately identify the source, so as to carry out environmental management and pollution prevention work more effectively.
Sales Manager:Ms. Emily Wang
Tel, Whatsapp:+86 15898932201
Email:info@fengtutec.com
Add:No. 155 Optoelectronic Industry Accelerator, Gaoxin District, Weifang, Shandong, China