Meteorological environment monitoring equipment supplier
Insist on doing high-precision customer favorite technology products

Meteorological environment monitoring equipment supplier
Insist on doing high-precision customer favorite technology products

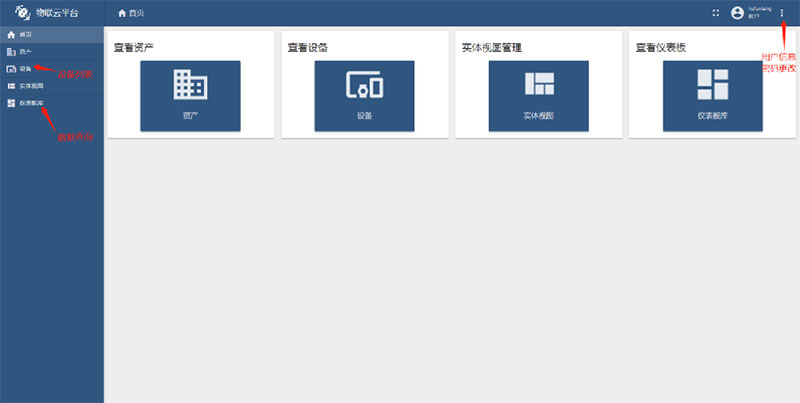
Fengtu Weather Cloud platform is a meteorological data receiving, processing and analysis platform based on Internet of Things technology. It supports MQTT equipment communication protocol, HJ212-2017, HJ212-2005 environmental protection protocol, TCP/IP short link data forwarding, HTTP protocol data forwarding and so on. The following is how to use the Windway Weather Cloud platform ——————
1. Obtain platform address and account number
After purchasing the company's Internet of Things equipment, please contact the online customer service. When registering the platform account, please provide your email address, company name and contact information.
2. Platform homepage
3. Device list
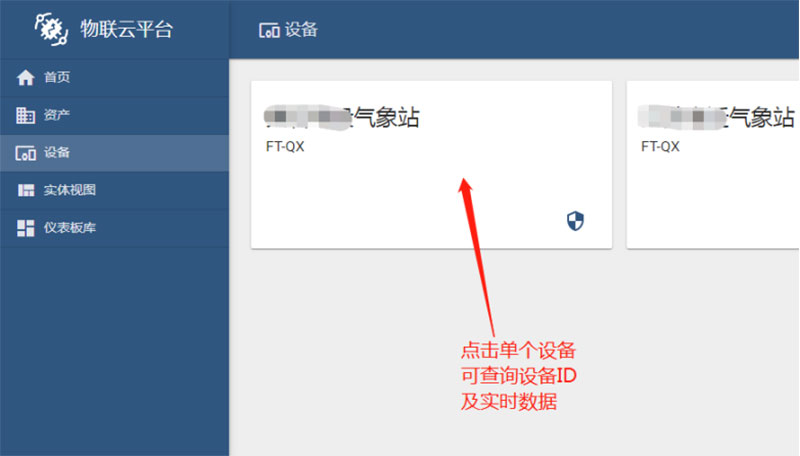
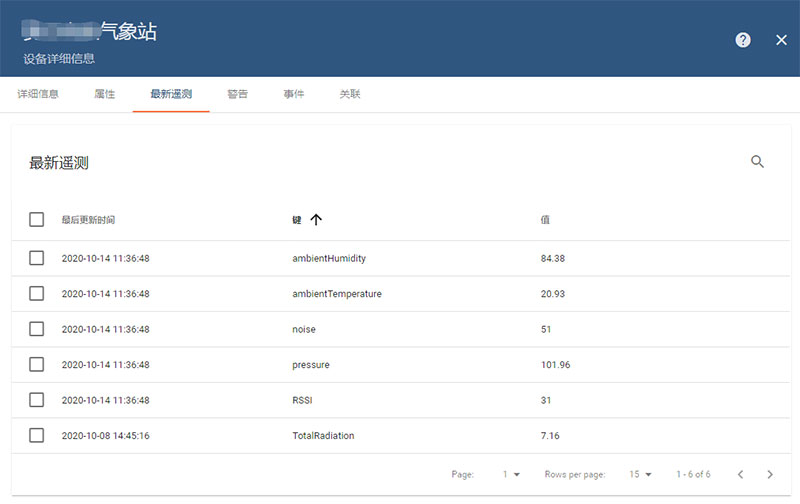
Click on a single device to display the basic properties of the device and the latest telemetry data of the device.
4. Data query panel
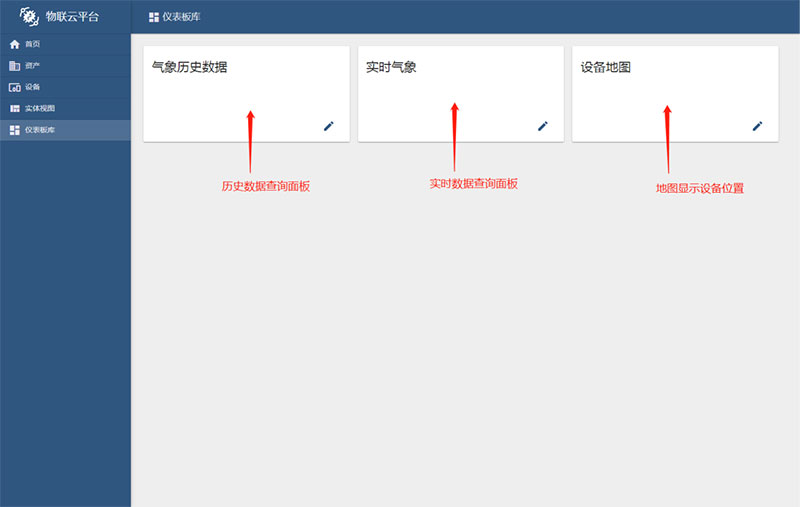
The actual panel assigned to the customer may be slightly different from the figure above, but generally contains at least three parts: historical data, real-time data, and device map.
5. Real-time data query
Click "Real-time weather" or "real-time Dust" in the "Dashboard Library" category to view the real-time data of the device.
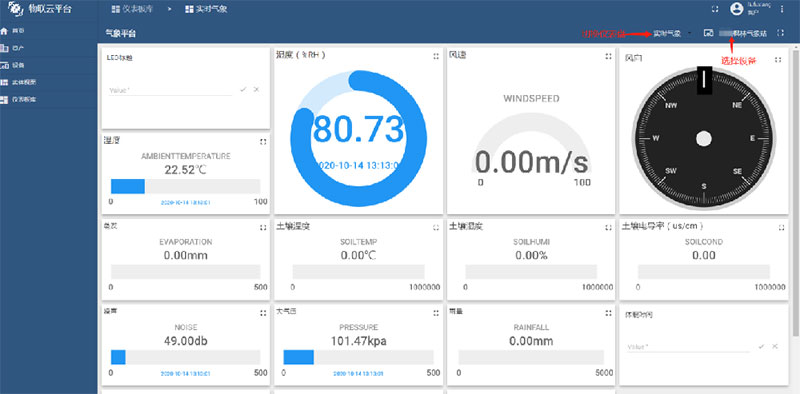
Different customers of device parameters will be assigned slightly different dashboards, and sensors not configured in the device will always display a value of 0 or "NaN" in the dashboard. Below each parameter is marked the last telemetry time of the specified parameter of the device, and the user can also judge the operating status of the device according to this time.
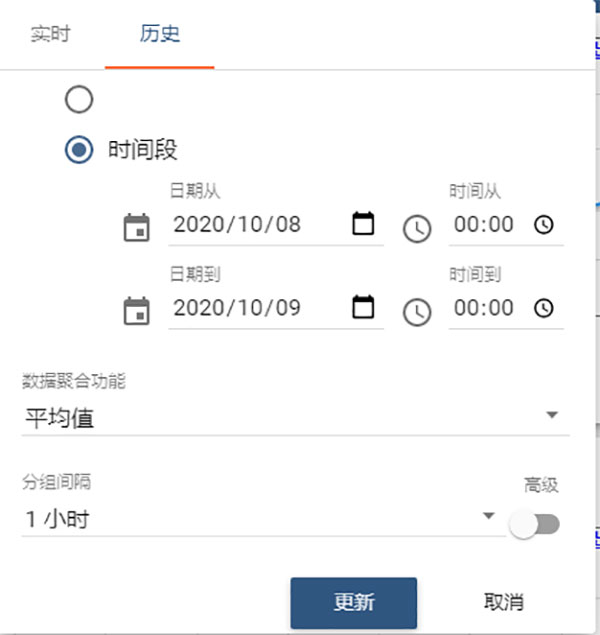
6. Query historical data
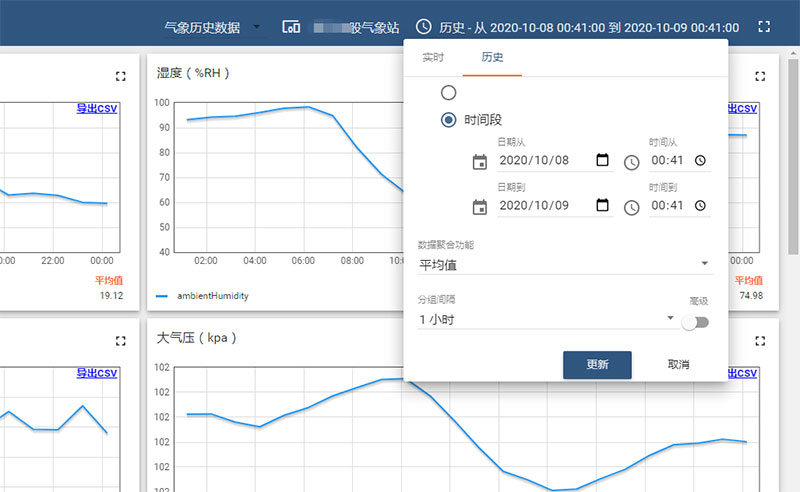
In the "Dashboard Library" category, click "Meteorological History data" or "Dust history data" to view the historical data of the device. The display on the dial may differ depending on the device configuration.
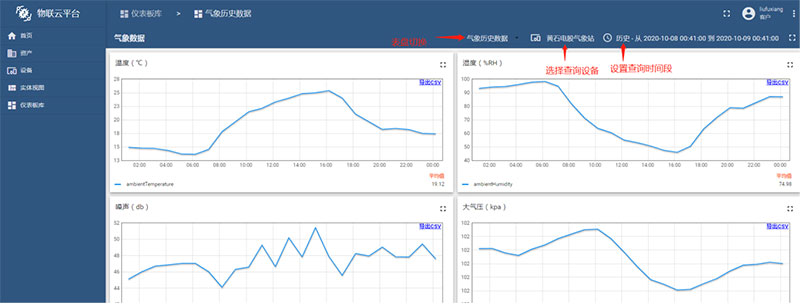
When setting the query period, note that the end time must be later than the start time, and the end time must be earlier than the current time.
By default, the Data aggregation option selects the average value, which means that the data is displayed on the chart after being averaged within a specified grouping interval. The grouping interval is the time interval between data points that display the icon.
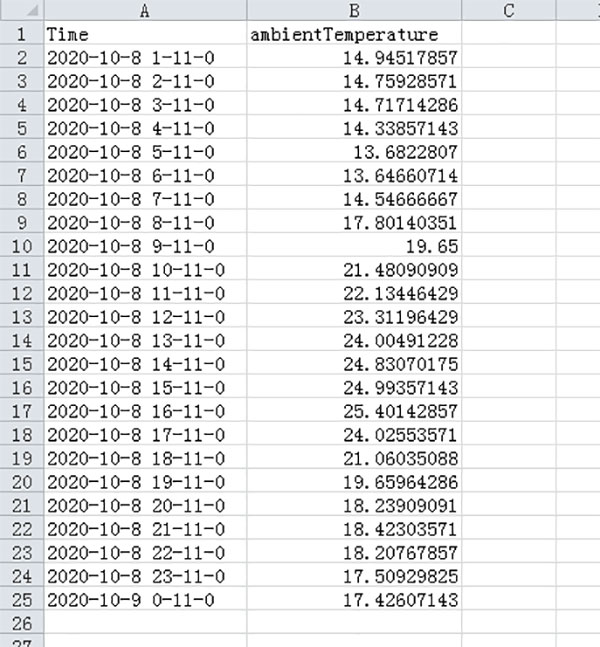
7. Export historical data
Each parameter in the historical data panel has the data export function. After you click Export CSV, the system will generate the parameter data at the specified data interval set by the user and automatically download the data. The file format is CSV. The name of the file is parameter name + start time.
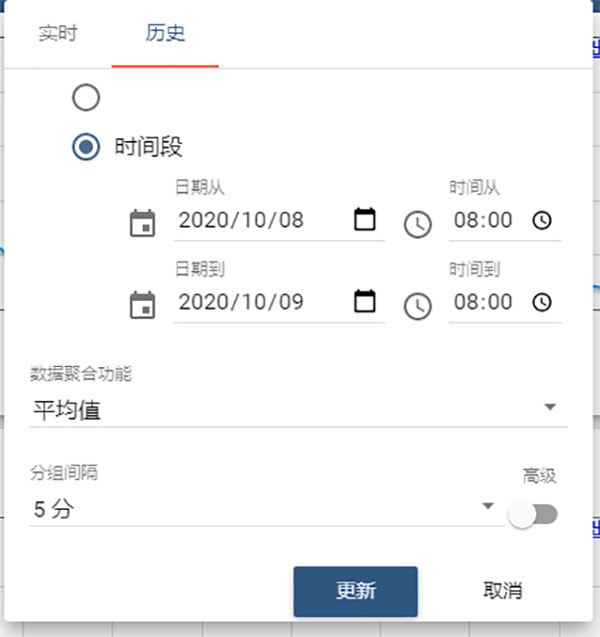
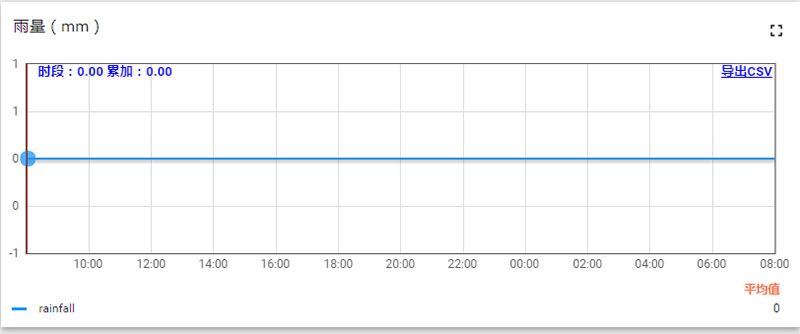
8. Query period data
If the sensor type is accumulative, you need to query period data (for example, daily rainfall).
For example, you need to query the rainfall between 8:00 on October 8, 2020 and 8:00 on October 9, 2020
1: Set the time range and click Update
2: Find the rainfall sensor view where the period value is both the specified period of rainfall
9. Integration data query
If you need to query the data integral value of the sensor (such as calculating the cumulative amount of radiation per day from the total radiation value), you need to use the integral data query.
Example: To query the cumulative radiation amount from 8:00 on October 8, 2020 to 8:00 on October 9, 2020, the unit is W·h/m2
1: Set the time period, select the average value for the data aggregation function, select 1 hour for the grouping interval, and click Update
2: Find the total radiation sensor view, where the "cumulative" item is the cumulative radiation amount of 6930.78 W·h/m2 in the specified time period, that is, 6.93078 kW·h/m2
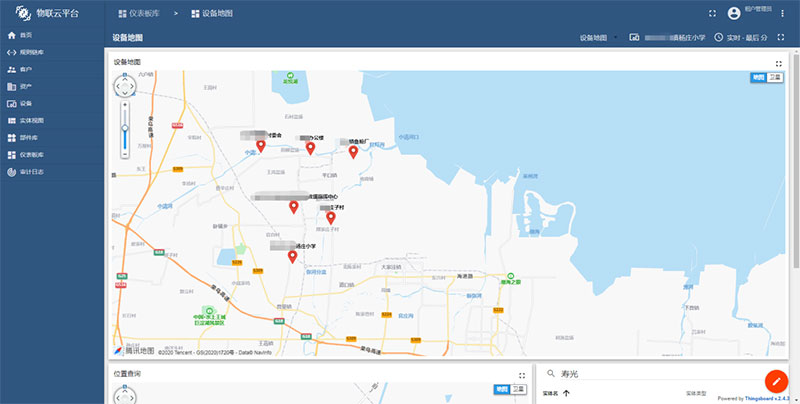
10. Device map
The device map function can be used to mark the installation location of the device for easy maintenance.
Click the Device Map option in the Dashboard Library to open the Device Map panel.
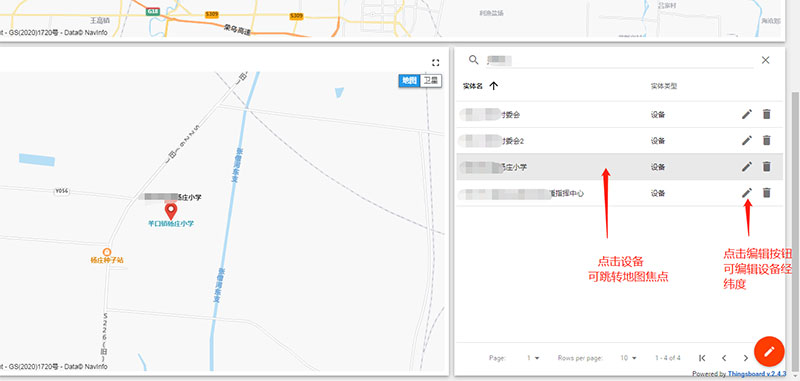
Equipment overview:
Device location query: Click the device on the right to jump the map focus to the specified coordinates.
Sales Manager:Ms. Emily Wang
Tel, Whatsapp:+86 15898932201
Email:info@fengtutec.com
Add:No. 155 Optoelectronic Industry Accelerator, Gaoxin District, Weifang, Shandong, China